Six Sigma Study Guide
Study notes and guides for Six Sigma certification tests


Full Factorial Design
Posted by Ted Hessing

Full Factorial Design leads to experiments where at least one trial is included for all possible combinations of factors and levels . This exhaustive approach makes it impossible to miss any interactions, as all factor interactions are accounted for. However, the thoroughness of this approach makes it quite expensive and time-consuming for experiments with multiple factors – this increases exponentially with the number of factors and levels.
Sample factorial design table for a three-factor experiment with two levels per factor
Calculating the Number of Trials
The number of trials required for a full factorial experimental run is the product of the levels of each factor:
No. of trials = F 1 level count x F 2 level count x … x F n level count
How Many trials in a Full Factorial Design?
Found by taking the number of levels as the base and the number of factors as the exponent:
Ex1. a design of 4 factors with 3 levels each would be: 3 x 3 x 3 x 3 = 3^4 = 81
Ex 2. 4 factors (A = 3, B = 2, C = 5, D = 4 levels). 3 x 2 x 5 x 4 = 120 observations.
Let’s look at an experiment with four factors:
- The first factor has two possible levels.
- The second factor has five possible levels.
- The third factor has three possible levels.
- The fourth factor has six possible levels.
To cover all of the potential combinations, the experiment will need:
No. of trials = 2 x 5 x 3 x 6 = 180 trials
Full Factorial Design Notes
- Full factorial designs include all possible combinations of every level of every factor.
- Full factorial designs can require a lot of trials, which can take a lot of time.
- Full factorial designs can require a lot of trials, which can cost a lot of money.
- Requires at least one observation for every combination of factors and levels.
- Allows for the measurement of all possible interactions.
- Expensive and time-consuming.
Analyzing Full Factorial Designs
Factorial anova.
You can use an Analysis of Variation – ANOVA to determine the results of full factorial design experiments.
Yates Analysis
Yates analysis is used in experiments with multiple factors, all having two levels. In some circumstances, the two levels can be ‘high’ and ‘low’ data points. It can be used in both full and fractional factorial design experiments. Read more about Yates analysis .
Why You Would Use Partial or Fractional Factorial Design Instead
One of the big drawbacks of fractional factorial design is the potential to miss important interactions.
Fractional factorials (like Latin and Graeco-Latin Squares ) will not allow the analysis of interactions. The interactions are confounded with other effects.
Moving from Full Factorial to Partial Factorial
- There will be fewer trials
- There will be confounding
- Resolution will decrease

Design of Experiments Factorial Design Video
I originally created SixSigmaStudyGuide.com to help me prepare for my own Black belt exams. Overtime I've grown the site to help tens of thousands of Six Sigma belt candidates prepare for their Green Belt & Black Belt exams. Go here to learn how to pass your Six Sigma exam the 1st time through!
Comments (14)
How many factor at least can be used in factorial design
Usha, I don’t understand your question. Can you elaborate?
For Usha, you can use at least two factors in a factorial design.
How can i fit and diagnose my model?
Lana – I’m going to need a bit more context than that to be able to help. Can you elaborate?
Thank you for the detailed explanation.
Can you please include some details about Linear & Quadratic Mathematical Models. Would be grateful for it.
How many experimental runs exist in a Full Factorial and fully randomized design for 4 factors with 2 replicates for the Corner Points and no Center Points? The factors in the experiment are only at 2-levels *
What have you tried, George?
When the search space is large, genetic algorithms can be tailored to find the optimal parameters. Better than a Partial design.
That’s really interesting. Where could we learn more?
Hi, i want to ask a question,i have been working on minitab lately. i saw a question and i cant this solve question.I see error=0 in my anova table Would you help me please? 0 (Low)1 (High) Factors Repeats A B C 1 2 3 4 0 0 0 46 50 50 58 1 0 0 70 59 52 61 0 1 0 51 39 59 53 1 1 0 51 55 52 40 0 0 1 48 48 44 66 1 0 1 36 40 37 33 0 1 1 48 47 65 47 1 1 1 39 66 62 47
What have you tried so far?
Full factorial designs do not adequately account for any factor interactions that may exist. Pls explain about this?
Hi Tharanga,
I’m unsure where you are seeing that. My text above states that full factor design is exhaustive. “This exhaustive approach makes it impossible for any interactions to be missed as all factor interactions are accounted for.”
Leave a Reply Cancel reply
Your email address will not be published. Required fields are marked *
This site uses Akismet to reduce spam. Learn how your comment data is processed .

- Testimonials
- Quality Resources
- Training Partners
- Academic Partners
- Partner's Login
- DiscoverSim
- SigmaXL iPad Templates
- Current Versions
- Register Product
- SigmaXL Trial
- DiscoverSim Trial
- Additional Resources
- SigmaXL Pricing
- DiscoverSim Pricing
- Request A Quote
- Order SigmaXL
- Order DiscoverSim
- Order SigmaXL iPad Templates
- Payment Options
- International Distributors
- System Requirements
- SigmaXL Guide
- DiscoverSim Guide
- PDF Downloads
- Search SigmaXL
- Product Activation FAQs
- Registration Portal
Overview of Basic Design of Experiments (DOE) Templates
- Two-Factor, 4-Run, Full-Factorial
- Three-Factor, 4-Run, Half-Fraction, Res III
- Three-Factor, 8-Run, Full-Factorial
- Four-Factor, 8-Run, Half-Fraction, Res IV
- Four-Factor, 16-Run, Full-Factorial
- Five-Factor, 8-Run, Quarter-Fraction, Res III
- Five-Factor, 16-Run, Half-Fraction, Res V
Three Factor Full Factorial Example Using DOE Template

Multiple Regression and Excel Solver (Advanced Topics):
- In order to run Multiple Regression analysis we will need to unprotect the worksheet. Click SigmaXL > Help > Unprotect Worksheet .
- In the Coded Design Matrix , highlight columns A to ABC, and the calculated responses as shown:

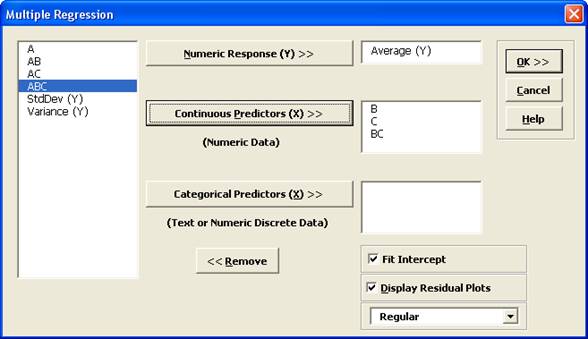
- Select Average (Y) , click Numeric Response (Y) >> ; holding the CTRL key, select B , C , and BC ; click Continuous Predictors (X) >> as shown:

Define, Measure, Analyze, Improve, Control

Simulate, Optimize, Realize

Our CTO and Co-Founder, John Noguera, regularly hosts free Web Demos featuring SigmaXL and DiscoverSim Click here to view some now!
Phone: 1.888.SigmaXL (744.6295)
Support: [email protected]
Sales: [email protected]
Information: [email protected]


IMAGES
VIDEO